Profiling Spring Roo with Java VisualVM
This post was born out of seeking to improve the performance of the GWT add-on in Spring Roo but the material is applicable to profiling any part of Roo or any application for that matter.
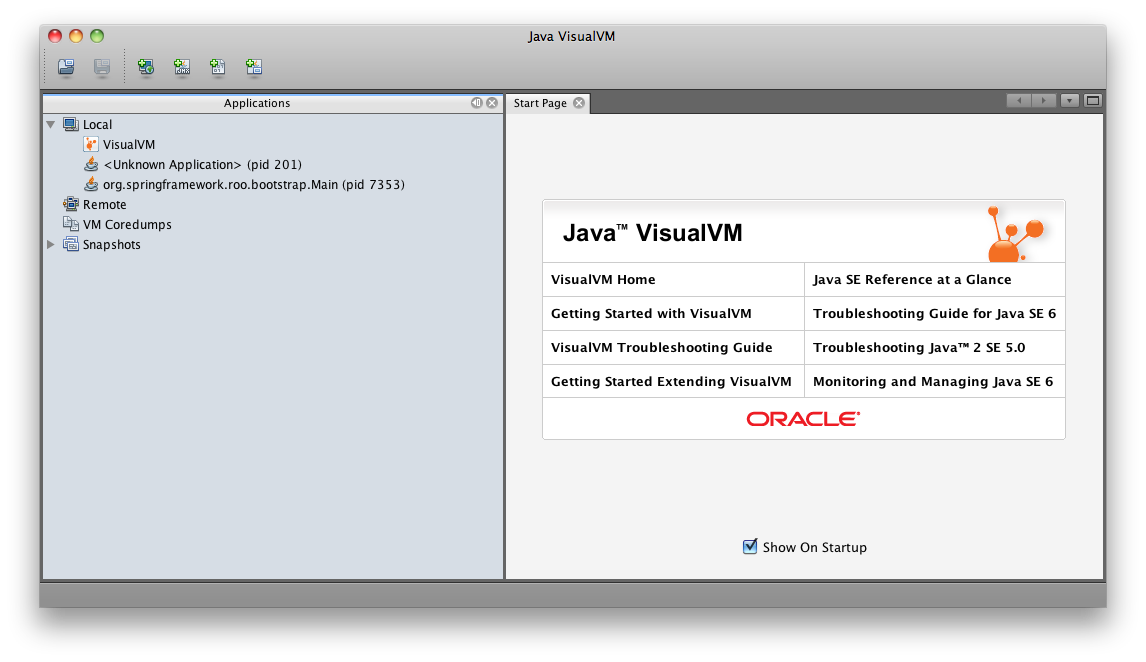
Before you do anything launch Java VisualVM from Terminal, or equivalent, by running “jvisualvm”. This wil launch Java VisualVM and you should be presented with the following (you may be asked to calibrate).
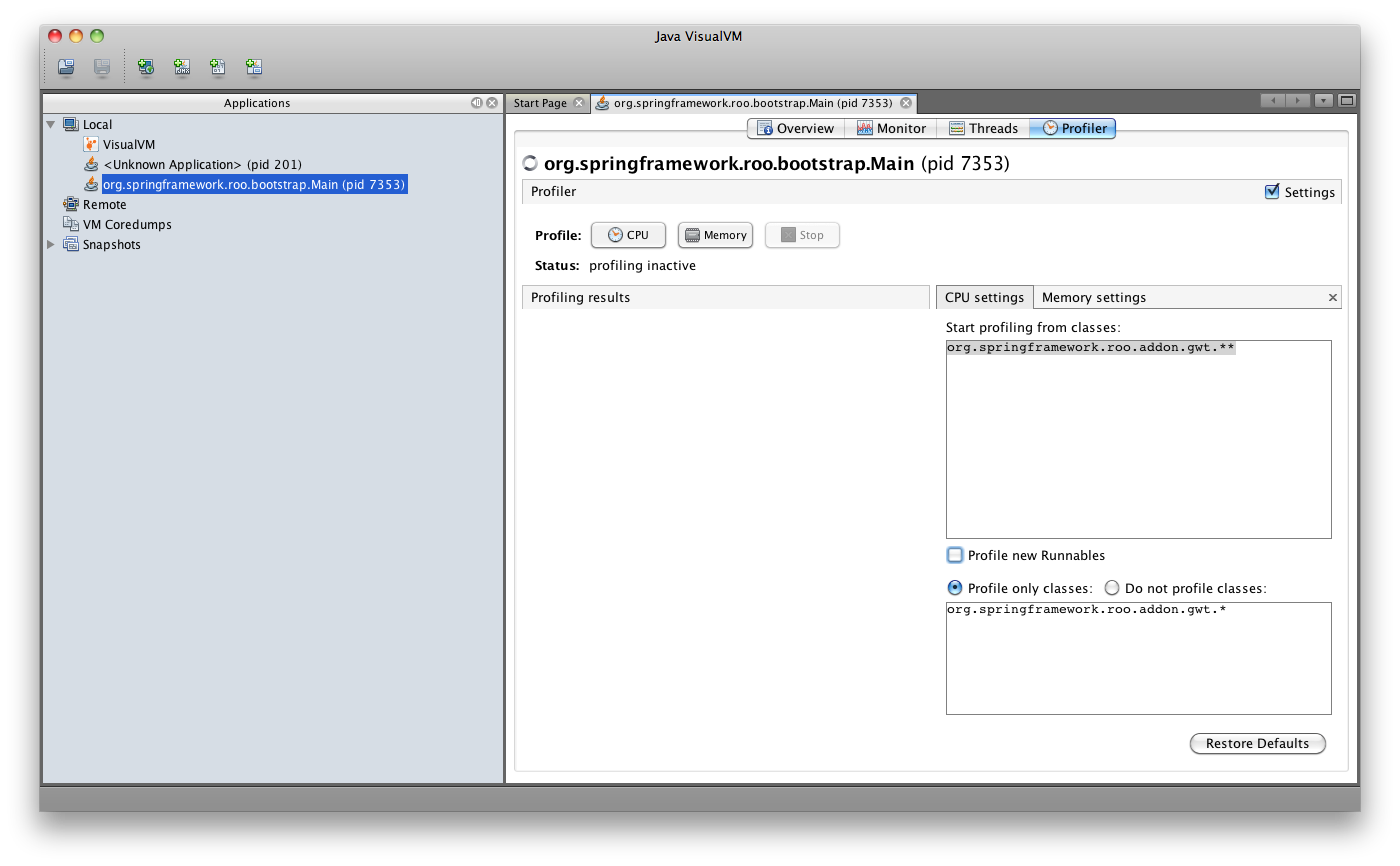
The “org.springframework.roo.bootstrap.Main” process is the one that we are interested in. Double click on it and select the “Profiler” tab. Check the “Settings” checkbox and designate which classes you want to profile. The more specific you are the less of an impact profiling has on your resources. I was only interested in the GWT add-on so i limited the scope to that add-on’s package as shown below.
Now uncheck the “Settings” checkbox and set the pause flag in Roo to attached profiler.
A flag was recently added to Roo’s launch script (ROO_HOME/bootstrap/roo-dev), which when set causes the roo to pause at startup to allow a profiler to be attached. The pause flag can be set by uncommenting (by removing the preceding hash i.e. #) the following line:
PAUSE="-Droo.pause=true"
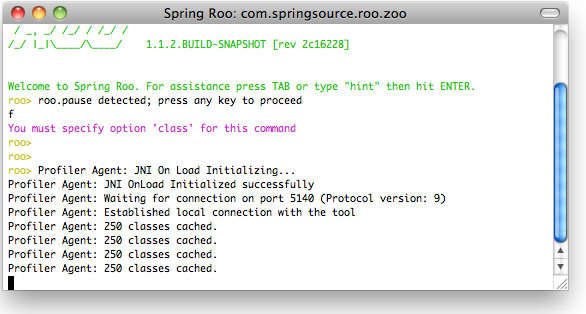
Once this line is uncommented the next time you run roo execution will be paused until you press a key. If all has gone according to plan you should be see the following.
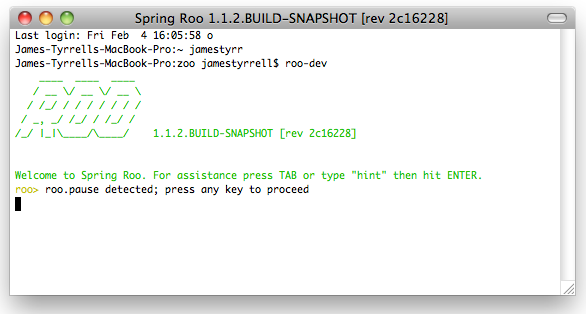
Now go back to Java VisualVM and click on the “CPU” button. It may take a moment to attach so be patient, if for whatever reason you are stuck on “refreshing…” please restart your machine and try again. You should see the following output in the Roo shell once the Profiler is attached.
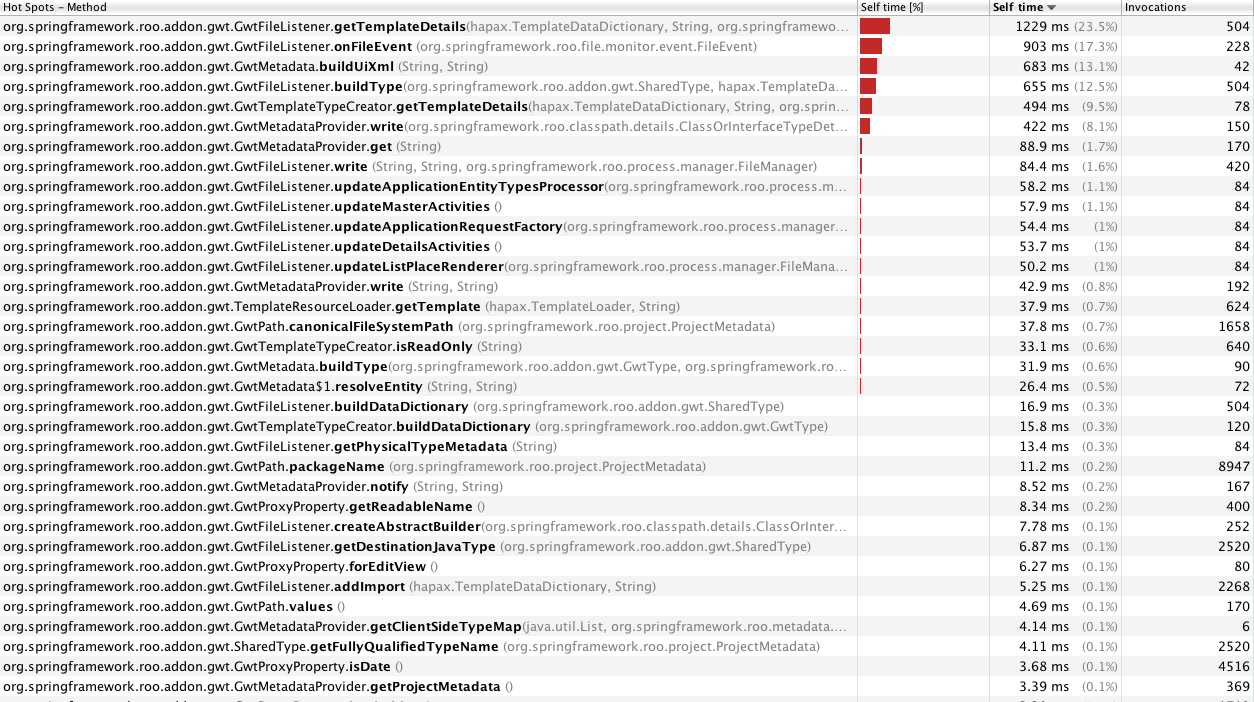
Press any key once the profiler is successfully attached continue launching Roo. If any methods of interest are encountered they will be displayed by Java VisualVM, below is the output whilst monitoring the GWT add-on.